Tag: debugWIRE

Stop-and-Go

The featured picture of this blog post is by WikimediaImages on pixabay.

One typical debugging activity is setting breakpoints and then running the program from breakpoint to breakpoint, inspecting the program’s internal state at each breakpoint. While this sounds simple, it gets complicated when one looks behind the curtain, which we will do in this blog post.

Continue reading

SNAP: Debugging for the Masses

The featured picture of this post has been created by DALL-E.

Microchip recently lowered the price for its hardware debugger SNAP from more than €50 to less than €20. I have recently created the Python script dw-gdbserver for this and other hardware debuggers so that you can now use SNAP in the Arduino IDE 2 to debug classic ATtinys and small ATmegas. All in all, this is an affordable and care-free debugging solution for classic AVRs.

Continue reading

Interrupted and Very Long Single-Steps

The featured picture of this post has been created by DALL-E.

It often happens in embedded debugging that you suddenly end up in the interrupt dispatch table while single-stepping through your code. Another unrelated problem is that sometimes, single steps can take an eternity. In this blog post, I address both issues and describe how to circumvent them in a gdbserver implementation.

Continue reading

Debugging 2.0

The featured image of this blog post is based on vector graphics by captainvector at 123RF.

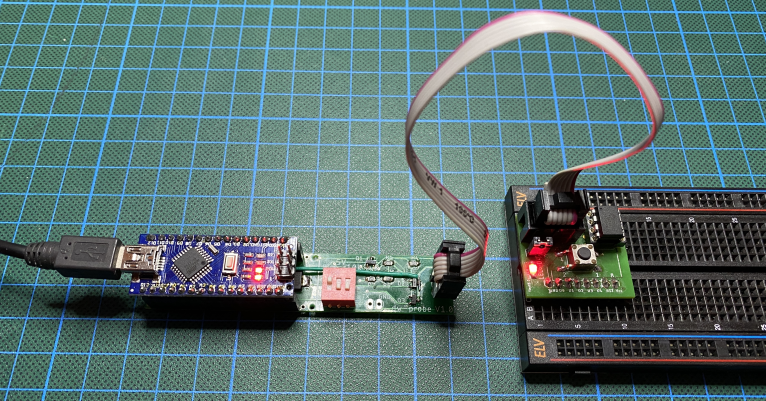
What keeps people from using a debugger? Well, it is mostly that one has initial costs in terms of setting up the debugging environment and of learning how to use the debugging tool. Hopefully, the next iteration of my hardware debugging tool dw-link, which is able to debug classic ATtinys and ATmegaX8s, will somewhat ease that burden, in particular, because you can buy the accompanying hardware now at Tindie.

I sell on Tindie

Continue reading

dw-link: A New Hardware Debugger for ATtinys and Small ATmegas

As mentioned in an earlier blog post this year, hardware debuggers are the premier class of embedded debugging tools. However, until today, there were only very few relatively expensive tools around supporting the debugWIRE interface that is used by the classic ATtinys and a few ATmega MCUs.

The good news is that now you can turn an Arduino UNO, Nano, or Pro Mini into a debugWIRE hardware debugger that communicates with avr-gdb, the AVR version of the GNU project debugger.

Continue reading

Copyright © 2025 Arduino Craft Corner

Theme by Anders NorenUp ↑