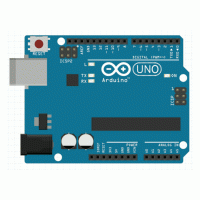
The featured image of this post is by WikiImages on Pixabay
You want to make a single step in your program, but the debugger takes you to some unknown area of the program. This was, in fact, my first experience when I tried out Microchip’s MPLAB X IDE debugger on the innocent blinking sketch. Is this a bug or a feature?
Problem
When one starts to search the web for “single-stepping and interrupts”, it becomes quickly clear that other people stumble over the same issue in many embedded debuggers. So what is the problem?
You have a piece of program that you want to single-step through using either step-over (called next in GDB) or step-in (called step in GDB) commands, but it does not work as advertised. Instead of executing one line and then stopping at the beginning of the next line, your debugger stops in the interrupt vector table. The reason is that an interrupt was raised and the interrupt handling sequence was started. So in fact, only a single line (or even only a part of it) was executed, but because the interrupt stepped in, you ended up in the interrupt dispatch table.
So, now we know why we ended up in the strange place. However, it is a very unsatisfying explanation. If you have a timer interrupt active that is raised every millisecond, you will probably never experience the pleasure of single-stepping through your code.
One finds two different kinds of advice for mitigating this problem:
- Instead of single-stepping, set breakpoints iteratively and use this to step through your code, interrupt routines will then be executed “in the background”.
- Define a debugger command on the user level that disables interrupts before the step and enables them afterward.
While it is possible to use these methods, there is, of course, the question of why the debugger does not implement one of them in the first place. Let us take a look at what the GDB debugger for AVR MCUs does, and how far a hardware debugger such as dw-link could support it.
How avr-gdb handles the problem
avr-gdb deals with this problem smoothly, most of the time. It translates a next or step command into a sequence of execute-single-instruction commands, perhaps interspersed with setting a temporary breakpoint and a continue-execution command to skip over a function call. Furthermore, if an execute-single-instruction command does not lead to the expected address in the program, the debugger sets a temporary breakpoint at the expected address and executes a continue-execution command. With this strategy, it avoids the issue described above–most of the time.
However, unfortunately, avr-gdb does not use the above strategy when the single-stepped instruction is the last in the sequence. In particular, if a lot of interrupts have to be served, e.g., when printing a string to the terminal, then it might happen that one still ends up in the interrupt vector table when single-stepping. I believe this is a bug, but it could be, of course, a feature, albeit a very confusing one.
I believe that interrupt routines, being highly time-critical, should be mostly transparent to the user. Only if one sets a breakpoint in an interrupt routine, then the debugger should stop there. The question is whether such a behavior could be implemented in the hardware debugger, that is, in the new dw-link hardware debugger.
How dw-link implements single-stepping
One can, of course, use one of the two methods described above, i.e., using a temporary breakpoint and a continue command or wrapping an interrupt disable/enable pair around the single-step command. Both methods are somewhat difficult to implement, though.
Introducing a temporary breakpoint on the level of the hardware debugger clashes with the breakpoint management since one needs to deallocate this temporary breakpoint even when one ends up, e.g., at a breakpoint in an interrupt routine, i.e., single stepping would not be local anymore. Further, for branching instructions, we either have to use two temporary breakpoints or we need a special solution for branching instructions such as simulating instead of executing them. So, the method is probably possible to implement, and would solve the problem, but would need a fair amount of code and one has to deal with a lot of corner cases.
The second possible solution, wrapping up a single-step command by an interrupt disable/enable pair, looks even worse because there exists a number of machine instructions that could potentially manipulate the I-bit or could be influenced by it (just think about push or ldd). All these instructions would have to be simulated.
Fortunately, there is a third solution. In debugWIRE, there exists a command to load an instruction into the instruction register and execute it offline. This command is used for many purposes, e.g., to read and write the general and IO registers. Another purpose is the execution of an instruction which has been replaced by a break instruction in the program memory. Instead of writing the instruction back to memory and then executing it, one executes this instruction offline. All machine registers are updated in the right way. However, apparently, all MCU timers are frozen. And no interrupts are raised when such an offline execution takes place (which is what we were looking for!). Two-word instruction have to be handled in a special way, e.g., by simulating them.
The third method, which has been implemented in dw-link, avoids the problem of ending up in the interrupt vector table completely. It has one drawback, though. It means that timers do not advance and pending interrupts from a timer or from an input device are not serviced as long as one single step, provided one does not skip over a function call somewhere. If one is aware of these limitations, I think the situation is much better than before. You can still request to handle single-stepping in the original way, i.e., single-stepping is interruptible, by using the debugger command monitor unsafestep.


Leave a Reply